 |
 |
|||||||||||
|
|
|||||||||||
|
Study of letter serial correlation (LSC) in some English, Hebrew, Aramaic, and Russian texts2. Experimental results -- randomized textsBy Mark Perakh and Brendan McKayPosted on October 20, 2009 CONTENTSA. Behavior of expected serial correlation sums and densities in randomized texts
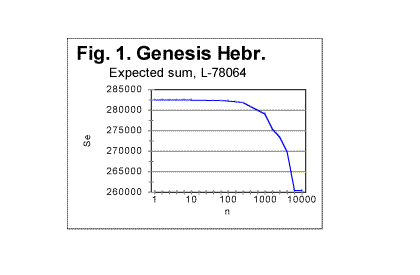
IntroductionThis is the second part of the report on the study of the Letter Serial Correlation (LSC) effect. In the first part (see Measurement and calculation) the calculation of the expected correlation sums and expected correlation densities as well as the measurements of the actual correlation sums and densities were described in detail. In this part the experimental results are described obtained for random texts. In the third part (see Experimental results -- real meaningful texts) the experimental results obtained with real semantically-meaningful texts are presented. In the fourth part (see Discussion and interpretation of experimental results ) the discussion and interpretation of the experimental data is offered. All four parts constitute one article and therefore the figures and tables are numbered continuously throughout all parts. A. Behavior of expected serial correlation functions in randomized textsa) Behavior of expected sumsWhile we expect that the expected sum Se will behave similarly in all randomized texts, the specific values of Se must depend, according to eq. (13C) on a) the total length L of the tested text; b)on the values of Mx - the numbers of occurrences of each letter in that text, and c) hence, on the number k of chunks in the particular test (e.g. on the size n=L/k of a chunk). Furthermore, if the text has been randomized, then the variations of letter frequencies X between adjacent chunks in such a randomized text must be random as well, and therefore along with the increase in chunk's size these variations must become smaller relative to a chunk's overall size. (Recall that quantitatively the expected sum for randomized texts is practically the same as for perfectly random texts). This must cause a decrease of the expected sum Se, when k decreases and, hence, n increases. Ultimately, Se must tend to drop toward zero for very large chunks. However, while the described general behavior of Se could be guessed with a reasonable degree of certainty, and also follows from formula (13C), possible quantitative peculiarities of Se's behavior cannot be excluded. Therefore we have calculated values of Se for randomized texts of different length, in Hebrew, Aramaic, English, and Russian. An example of the dependency of Se on the chunk's size n is shown in Fig 1. The overall behavior of the expected sum is essentially identical for various text's length and even for various languages. This is compatible with the fact that the expected sum is calculated for a randomized collection of symbols, without any relation to their graphical appearance, or to their meaning or to a semantic context, and therefore it must depend only on the number of symbols in the set, on the overall length of the "text," and on the symbols' frequency distributions.
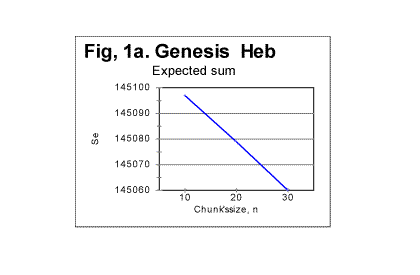
We have obtained many more graphs of the type presented in Fig 1, all displaying similar principal shape of the Se vs n curve. The shape of the curve in Fig 1 is the result of two factors. One factor is an illusion, as it is simply caused by the non-proportional graduation of the horizontal axis in Fig. 1. Replacing the scale on the abscissa by a proportional one would stretch the right side of the graph, so the steep drop of the curve at n>100 would be largely eliminated. However, even with a proportional horizontal scale the graph would not convert into a straight line with the intercept of A and slope of B, as formula (13C) suggests, and, again contrary to the prediction of formula (13C), Se will reach zero value not at n0=L, but at a smaller nf<n0. The reason for that is the use of variable, truncated values of L* instead of the full text's length L, as it was explained earlier in Part 1 of this paper. If we look again at Table 1 in Part 1 of this paper, we notice that there are stretches of values of n for which L* is the same. For example, for all three values of n = 10, n = 20, and n = 30, the value of L* is 78060. Similarly, for n of 100, 200, and 300, L*=78000 for all three of those n. Such stretches of constant L* are interspersed with values of n, for which L* undergoes an abrupt change. For example, for n=2, L=78064, but for n=3, L*=78063. Wherever there is stretch of n values with an identical value of L*, the corresponding segment of the Se-n curve is a perfect straight line, as formula (13C) suggests (if the horizontal scale is made proportional). This is illustrated in Fig. 1a, showing the segment of Se-n graph for n between 10 and 30, the horizontal scale being this time proportional. The straight line in this graph, with a slope of 1.85, fits perfectly the prediction of equation (13C). On the other hand, wherever the value of L* changes abruptly between two adjacent values of n, the slope of Se-n graph undergoes a steep turn. An example is shown in Fig.1b, for n between 1 and 3. The small change of L* from 78064 for n=2 to 78063 for n=3 caused the drastic slope's increase from 1 to 4. As the chunk's size grows, the slope's increases accumulate, so overall the graph takes the shape of an incomplete polygone dropping toward zero with a slope increasing to the right.
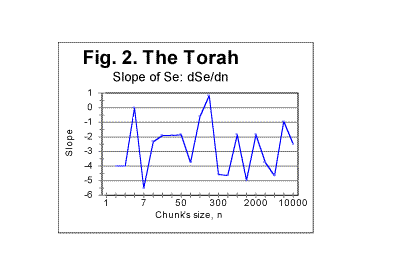
Another result of the text's truncation, also tied to the slope's variations, is the appearance of wriggles on Se-n graph. As can be seen in Table 1 (in Part 1 of this paper) the value of L*, while displaying an overall gradual decrease when n increases, at some values of n shows local increases. For example, for n=70, there was L*=78050, but for n=100 it became L*=78064. In Fig 2 the graph of the slope of Se vs n curve, as a function of n, is shown as an example, deliberately using a large scale, illustrating the effect of text's truncation that causes the above mentioned wriggles. This example was obtained on the entire text of the Torah in Hebrew. Similar graphs were observed for other texts as well.
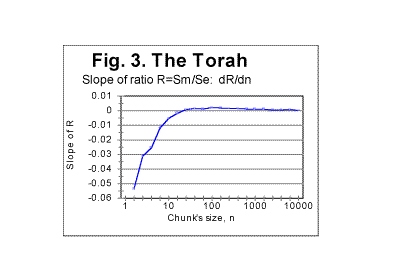
It seems appropriate to make now a temporary excursion into the next section of this paper, to discuss the problem of the relation of the wriggles in question to the shape of the graphs of measured sum, Sm vs n, as this problem is one of filtering out artifacts generated by text's truncation. ** Identifying and filtering out artifacts generated by texts' truncationThe curves for both Se vs n and Sm vs n are obtained, one by calculation, and the other by measurement, for the same set of actual lengths L*. Therefore the wriggles caused by the text's truncation distort both curves at the same values of n, even though the sizes of the wriggles may be different for Se-n and Sm -n curves. The wriggles on Sm-n graphs can be erroneously believed to be genuine manifestations of the texts properties, while actually being artifacts stemming from texts' truncation. Let us discuss those possible artifacts. Three alternative situations can be envisioned, to wit: 1) At a certain value of n, there are similar local irregularities (either maxima or minima) on both Se-n and Sm-n graphs. Almost certainly, it indicates that the irregularities on Sm-n graph are juct artifacts caused by the text's truncation, as it was described earlier, rather than genuine manifestations of texts' properties. 2) At a certain value of n, there is either a local maximum or a local minimum on Sm-n graph, but there is no corresponding irregularity on Se-n graph. Almost certainly this indicates the presence of a genuine characteristic point on Sm-n graph which reflects some intrinsic facet of the measured sum's behavior. 3) A rare situation when there is an irregularity at a certain value of n on Se-n graph, but no corresponding deviation from a smooth graph's run on Sm graph. This may indicate that there is a genuine (probably not strongly pronounced) maximum or minimum on Sm-n graph, and also, at the same n, accidentally exists a quirk on Sm-n graph, caused by text's truncation, whose deviation from the smooth Sm-n curve is in the direction opposite that of the genuine irregularity and is thus masking the genuine maximum or minimum on Sm-n graph. Hence, to filter out the artifacts in question, both Sm-n and Se-n graphs must be viewed simultaneously. The first two of the three described situations had been actually observed in real texts. Often the simplest way to distinguish between an artifact in question and a real characteristic point is to plot the ratio R=Sm/Se. If the wriggles caused by truncation happen to be of comparable size for both Se and Sm, these wriggles will be largely suppressed on R vs n curve, thus indicating the presence of artifacts. In Fig. 3 the slope of a ratio R of the measured sum Sm (see equation A) to the calculated expected sum Se (see formula (13C) R=Sm/Se is shown as a function of n, for the same text as in Fig. 2. We see that the slope of R is rather smoothly changing with n, thus illustrating the suppression of wriggles which are caused by the text's truncation, when viewing graphs for ratio R rather than for Se or Sm separately.
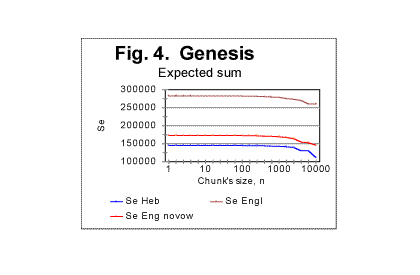
The ultimate judgement as to which irregularities observed on Sm-n graph are genuine characteristic points which reflect the text's properies, and which are artifacts stemming from text's truncation, can be made by reviewing several similar graphs for a number of texts, preferrably with different values of actual lengths L*, and choosing the alternative that is most consistent with all the information available on the behavior of texts in question. Except for a few rare situations where the evidence seemed to be somehow ambiguous, usually the distinction between artifacts and genuine manifestations of text's properties was rather apparent. ** Now we return to the subject of this section. In Fig. 4 three curves are shown displaying the expected trivial dependence of Se on the overall length of the text.
The uppermost curve in Fig. 4 shows the expected sum for an English text, whose length was 151836 characters which is the length of the English translation of the Book of Genesis. The lowermost curve on that graph relates to a Hebrew text 78064 letters long which is the size of the Book of Genesis in Hebrew. The curve slightly above the one for the Hebrew text was obtained for an English text whose original length was 151836 letters, but which was stripped of all vowels, so its overall length decreased to 99493 letters. This graph clearly demonstrates the expected natural effect of the text's overall length on the expected sum. b) Behavior of expected densitiesFig. 1 which shows the curve for the expected correlation sum for the Book of Genesis is again reproduced here, and next to it Fig. 1c is placed demonstrating the dependence of the Letter Serial correlation density de on the chunk's size n, for the same text.
Comparing the two graphs shows the clear difference between the behavior of the extensive quantity -- the expected sum Se, and the intensive quantity - the expected density de for the same text. Since the theoretical equation for the expected density (formula 17) is that of a hyperbolic curve, which implies linear dependence of the logarithm of density on the logarithm of n, it is instructional to view the "log n"-dependence of the logarithm of the expected density for a real text, where the text's truncation must cause a certain distortion of the straight-linear graph, as it was discussed earlier in this article. The results for the same text of Genesis in Hebrew are shown, as an example, in Fig. 1d.
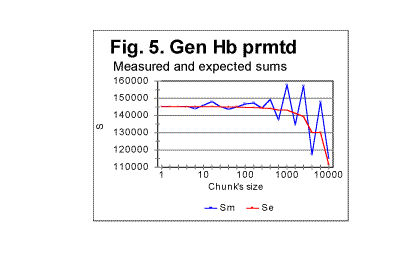
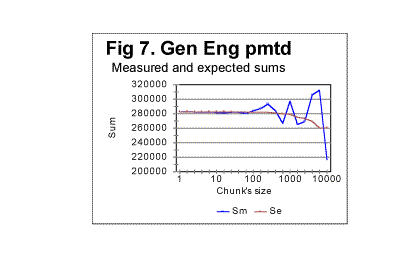
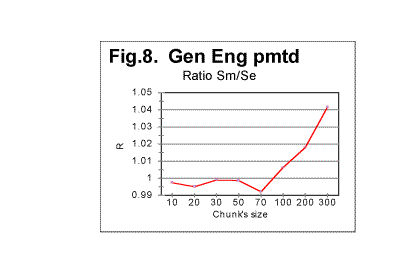
Regression analysis of the plot in Fig. 1d reveals that the graph is very close to a perfect straight line (the correlation coefficient for the least square fit is close to 0.999), and the equation best approximating the de vs n function is for this text as follows: de=145121×n-1.014 . Comparing this equation with the theoretical equation (17) shows that the text's truncation caused a change of the power from the theoretical value of -1 to -1.014, which means that in equation (20) q=1.014 (and, of course, the curve described by the above equation, is shifted vertically relative to that given by eq. 20, by a distance of T, which shift is inconsequential for our discussion). Otherwise, the Letter Serial Correlation density behaves quite close to the theoretical expectation. Very similar results were obtained for all explored texts. B. Behavior of the measured correlation sum in texts randomized by permuting letters of a meaningful texta. General discussion of randomness in permuted texts.We will refer to the texts obtained by permuting the letters of an original meaningful text as randomized texts. It must be realized though that permuting letters of a text by no means guarantees that the permuted version will have a high degree of randomness. If a meaningful text comprises L letters, and the pertinent alphabet consists of z letters, there potentially exist Pni=L!/n1!n2!n3!......nz! equally probable distinguishable permutations of that text where n1, n2.......nz are numbers of occurrences of each letter of the alphabet in the text in question. For example, if the text is in English, and comprises, say, about 150000 letters, which is the approximate size of the English translation of the Book of Genesis, the number of its potentially possible, equally probable distinguishable permutations is (150000)!/na!nb!nc!.... nz! where z=26. A repeated process of random permutations can produce, with equal probability, distinguishable and non-distinguishable permutations. The number of all possible, equally probable permutations, including non-distinguishable versions, is even larger, as it is Pi=L!. It is a very large number indeed. Among those numerous permutations potentially exist versions both more random than the original meaningful text, and less random than the original text. For example, there is necessarily among the possible permutations one version where all letters A from the original text are gathered one after the other at the beginning of the permuted text, followed by all letters B from the original text bunched sequentially, then all letters C from the original text arranged sequentially right after the last of B, and so on, throughout the alphabet. Such version would possess a very high degree of order, i.e. a very low value of entropy. The creation of such a version as a result of a random permutation of the original text has the same probability (which is 1/P , i.e. is very small indeed) as the creation of any other of the multitude of possible permutations. The above statement can be illustrated by the following simple example. Consider the following sentence: THESE ARE EXAMPLES OF MULTIPLE ELS CREATED WITHIN A RANDOM CONGLOMERATE OF VARIOUS LETTERS . (ELS is a commonly used abbreviation for Equidistant Letter Sequences [1-4]). This text consists of 77 letters (we ignore spaces). There are 77! (which is about 1.45×10113 ) possible permutations of that text. Among those vastly numerous permutations are the following three distinguishable permutations (swapping positions of identical letters, many permutations indistinguishable from each of those exemplified below can be constructed): 1)TMITAMIHPPENEOELLDDRUSEEWOASESEIMTLAOLTCEERFSHOOTEMCINFTEURNGVEXLEA- LARATARORS. 2) SRORATARLEALXEVGNRUETFNICMETOOHSFREECTLOALTMIESESAOWEESURDDLLEOENE- PPHIMATIMT. 3)TMHPIELPASELTNESEEACAOEDROERFLWANRFEMSINGAVOEUCTDLTAUEXLRHOOERSTEAT-- EIMMOILTRS. Each of the above strings of letters contains exactly the same 77 letters as the original message, these letters being shuffled, so that all three strings are permutations of the text of the original message. At a glance, all three above permutations of the original message look as gibberish, that is as fully random conglomerates of letters. Actually, however, each of the above permutations possesses the same degree of order as the text of the original meaningful message. These three permutations are actually encrypted (in a rather simple way) texts with the same (hidden) semantic contents as the original text. To decode the above encryptions let us mentally concatenate the ends of each of those strings of letters to the beginnings of the same strings. First look at string #1. Starting from its first letter T count seven subsequent letters. In position 8 there is letter H. Skip again seven positions, and there is letter E. Continue the procedure, and, when the end of the string has been reached, go back to the beginning of the string, and continue skipping seven-letters intervals. Following this rule, we decode, letter by letter, the original text, which has been encrypted using ELS (Equidistant Letter Sequences) with a skip of 7. In string # 2 start with the last letter and count letters from right to left (as string #2 is actually string #1 written in the reverse order). Again, we find that the original text has been encrypted in this string, but this time with the skip of -7. Finally, string #3 also is an encrypted version of the original text, but this time instead of ELS (Equidistant Letter Sequences) the GISLS (Gradually Increasing Skip Letter Sequences) have been employed. The skip between the first and the second letter of the message is 2, between the second and the third letter it is 3, etc., and when we reach the end of the string, the skip having increased to 11, we continue by skipping 12 positions and going back to the beginning of the string, and continue counting skips, again starting with skip of 2, following it by skip of 3, etc. Hence, even though all three encrypted versions are among the permutations of the original text, they possess the same degree of order, and hence the same value of entropy, as the original text. It is easy also to construct an example of a permutation of the above 77-letter text which would possess a higher degree of order than the original message. The message contains the following frequencies of letters: A-7, B-0, C-2, D-2, E-12, F-1, G-1, H-2, I-4, K-0, L-6, M-4, N-3, O-5, P-2, R-6, S-5, T-7, U-2, V-1, W-1, X-1, Y-0, Z-0, the total of 77 letters. Let us arrange them in the following order: 4) AAAAAAACCDDEEEEEEEEEEEEFGHIIIILLLLLLLMMMMNNNOOOOOPPRRRRRRSSSSSTTT- TTTTUUVWX. The above string consists of the same 77 letters as the original message, and therefore it is one of the possible permutations of the original text. The degree of order in that permutation is higher than in the original text since all letters are now arranged in a strict order. This particular permutation's appearance has the same individual probability as any other of the multiple possible permutations of the original text. The above consideration must not be construed as the statement that the appearance of highly ordered permutations is very likely. Actually, the likelihood of its appearance is exceedingly small, even though it is not any smaller than for any other permutation. Furthermore, among the multitude of possible permutations, the number of versions with a high degree of randomness is much larger than that of versions with a high degree of order. That number is an exponential function of the version's entropy. Therefore, while the probability of creation (via permutation of the original text) of any specific version is the same for all versions regardless of the version's entropy, versions with high entropy, i.e. with high degree of randomness, will be created via random permutations much more often than versions with high degree of order, simply because there are many more possible versions with high entropy. The probability that a random permutation results in some version with high entropy is much larger than that it results in the creation of some version with a low entropy. In other words, among the multitude of possible permutations of a text, there are many versions with high entropy than there are versions with low entropy. By far the most likely result of a set of random permutations is a set of versions greatly randomized as compared with the original, well ordered meaningful text. b. Experimental results with permuted texts - sumsIn view of the above consideration, let us look at the results of the comparison of serial correlation sums, measured for randomly permuted versions of original texts, with expected sums for the same texts, calculated as described in Part 1. This comparison will be our next step in establishing foundation for the interpretation of the behavior of serial correlation sums for real meaningful texts. Some selected results in question are shown in Fig. 5 through 8 In Fig. 5 both the calculated expected correlation sum (red curve) and the measured correlation sum (blue curve) are shown for one randomly permuted version of the Hebrew text of the Book of Genesis, whose length is 78064 letters. This picture exemplifies the typical behavior of the measured sum for randomly permuted texts. As long as the chunks are relatively small, both curves, that for Sm and that for Se run rather close to each other, so that the ratio of Sm/Se is quite close to 1. Starting at some value of chunk's size n, the measured sum experiences increased fluctuations around the diminishing value of the expected correlation sum. To locate the threshold value of n, let us look at a zoomed-in graph of the ratio R=Sm/Se, shown in Fig. 6 for the same text. We can see that the fluctuations of Sm around Se (i.e. deviations of R from 1) increase quite drastically starting at n=20. Similar behavior was observed for other permuted texts. One such is shown in Fig. 7 for the English translation of the Book of Genesis whose length is 151,836 letters. To locate the position of the threshold at which the fluctuations of Sm (about the dropping value of Se) substantially increase, look at the zoomed-in curve for ratio R=Sm/Se vs n, shown in Fig. 8. The threshold in question seems to be in this case at about n=70. The observation of data like those shown in Fig 5 through 8 reveals that the substantial increase of fluctuations of the measured sum Sm about the calculated value of the expected sum Se starts at a threshold value of chunk's size n which, within the framework of the precision level inherent in these graphs, in all cases matches the chunk's size n being either at or a little above z, the number of letters in the pertinent alphabet. As this section is of a preliminary character, and is mainly designed only to establish reference points for the study of LSC effect in real, non-randomized texts, we will not undertake here an attempt at a detailed interpretation of the mechanism connecting the mentioned threshold to the number of letters in an alphabet, however this question might invoke curiosity in its own right. We will rather limit ourselves to a statement of a factual observation, namely that at n=z or at a little larger values of n, when the chunk's size becomes larger than z, the constraints imposed by the limited size of chunks are lifted, and the letters of the text take advantage of the now available freedom of fluctuations. c. Additional discussion of randomness in permuted texts. Crystal vs liquid analogyLet us discuss a little more the question of the degree of randomness of the permuted and non-permuted texts. There is an analogy here with the question of degree of order in a solid crystal vs liquid. We will use this analogy later in this paper to analyze LSC in texts. Term "crystal" in Physics means a solid body whose constituents (atoms, or ions, or molecules) are arranged in space in an orderly fashion. On the other hand, amorphous bodies (also referred to as liquids, even if they seem to be solid, as, for example, glass) consist of elements (molecules, ions, atoms) whose distribution within the volume of the body is largely chaotic. Physicists distinguish between the long range and the short range orders in crystals. Long range order manifests itself in a repeated spatial configuration of particles throughout the entire macroscopic dimensions of the crystal. Short range order extends only over certain number of "steps" if one imagines moving through the crystal. When the number of steps exceeds certain value, usually not more than about ten-fifteen steps, each step being the size of the interatomic distance, the configuration of particles forming the short range order pattern, changes. If the temperature of the crystal rises above the melting point, crystals transform into liquid. In the melt, the long range order becomes destroyed. However, short range order may be preserved to a certain extent if the temperature is not much higher than the melting point. Investigation of liquids indicates the presense of a certain degree of such short range order. The ordered clusters of particles that are present in the liquid as islands of order within the sea of disorder, may have various origins. Some of these ordered clusters may be inherited from the parent crystal, which may be due, for example, to gradients of temperature and density within the melting crystal in the vicinity of the melting point. More of those clusters are generated however by thermal fluctuations of particles' spatial distribution in the liquid itself. Such ordered clusters appear at various locations, then disappear, appear at other locations etc. The result is that there is a certain degree of order in liquids, even though overall they are amorphous bodies. Similarly, most of the texts obtained by permutations of a meaningful text, preserve a certain degree of order. Within the sea of disorder created by shuffling letters of the original text, there may exist (and indeed do exist more often than not) islands of ordered confguration of letters. Some of them may be inherited from the original text by a sheer chance, but more of them emerge stochastically as a result of the random permutation. It is desirable to have some, at least quite approximate, measure of the degree of randomness of a text. One such measure may be introduced as follows. Look at Table 2. It contains, as an example, the results of an actual experiment, this one perfomed on an arbitrarily chosen particular permuted version of the Hebrew text of the Book of Genesis. Table 2. Genesis, Hebrew, permuted version n - chunk's size; Sm - measured sum; Se - expected sum; R=Sm/Se
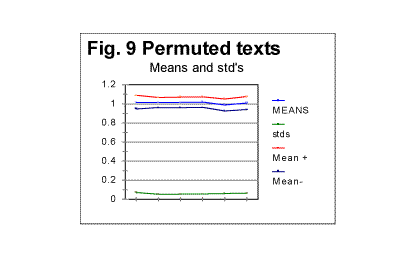
The leftmost column lists the sizes of chunks explored (recall that the chunk's size is n=L/k, where L is the total length of the text which for the Hebrew text of Genesis is 78064 letters, and k is the number of chunks into which the text is divided for each measurement). Two columns in the middle show the values of the measured Sm and expected Se serial correlation sums. Finally, the rightmost column shows the ratio R=Sm /Se . Since the expected sum Se is calculated based on the assumption of randomness of the text, then, the larger is the degree of randomness of the text, the closer must be Sm to Se . In other words, the deviation of ratio R from the value of 1 may serve as an indication of the degree to which the tested text is close to be perfectly randomized. Measuring R provides some clue as to whether randomization has destroyed the type of order represented by "serial correlation." Since "serial correlation" does not exist in vacuum, but is a part of the text's overall complex structure, then R being different from 1 indicates also the presence of some types of orders different from "serial correlation" as well. To estimate the degree of randomness, we first calculate the mean value of Rm over the entire rightmost column. For the above table, it turned out to be Rm =1.014. Then we calculate the standard deviation of R for the same set of values. For the above table it happens to be std(R)=0.053. We repeat the described procedure for a number of permuted versions of the text in question. Fig. 9 shows the results obtained for six such trials, including 5 Hebrew and 1 English texts of Genesis.
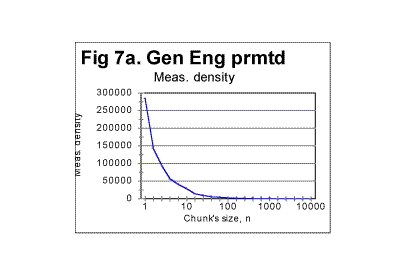
In Fig 9, the lowermost (green) curve displays the values of std(R) - standard deviation of R - for those six arbitrarily chosen permuted versions of the Book of Genesis. The blue curve in the middle of the triplet of curves at the top of the graph represents the mean values of ratio R, calculated for the same arbitrarily chosen permuted texts. The uppermost (red) curve displays the sum [Rm + std(R] while the lower (black) curve in the triplet shows the value of [Rm - std(R)]. The first conclusion from surveying Fig. 9 is that all six permuted versions of the text happened to be well randomized, as the mean of ratio, Rm for all of them is reasonably close to 1. On the other hand, it is obvious, that each of those six versions possessed a certain degree of order, as in no case was observed Rm =1. To estimate the degree of randomness, we may suggest the following coefficient, which will be denoted Dr (which stands for "degree of randomness") Dr =1-[std(R)/R]....................(14) For the text represented by Table 1, the value of this coefficient happened to be Dr=0.948. We have no illusions in regard to the limitations of that coefficient. Indeed: a) This coefficient is just one of many possible quantities which can be used for the estimation of randomness; b) This coefficient is a rather crude measure of randomness. Indeed, it is based on measuring the destruction of only one type of order, namely that of serial correlation. Even though all types of order present in the text must be interconnected, and overlap each other, still the destruction of the serial correlation is not necessarily accompanied by equal destruction of other types of orders, which may be weakened but still preserved to some extent, different from that of the serial correlation. We do not know which types of order and to which extent contribute to the overall degree of order, serial correlation being only one of many possible overlapping types of order. It may be nevertheless advantageous to apply Dr to compare degrees of randomization which has been produced by various means (for example letter permutation, verses permutation, word within verse permutation, etc). While using Dr, we should remember the crude nature of that measure, but its advantages are its being simple, easily calculated, and transparent as a first approximation measure. The ultimate judgement in regard to the desirability of using Dr as a measure of text's randomness can be done only by having actually used it and observed its behavior. We will see that in some situations the coefficient in question turns out to be reasonably useful as a tool sensitive to variations in texts. For example, for 15 randomly permuted versions of the text of Book of Genesis, of which five were in Hebrew and ten in English, the mean value of the coefficient in question turned out to be Dr = 0.94, while the minimum value of it among the fifteen permutations explored happened to be Dr=0.93, and the maximum Dr=0.961. It can be interptreted that, by a rough estimate, the process of permutations succeeded to produce texts being, on the averagge, 94% randomized, the randomness in those fifteen texts varying between 93% and 96.1%. Applying the coefficient in question to non-permuted meaningful texts may enable us to estimate their degree of order, presumably being much larger than in permuted versons, at least as far as the letter serial correlation is concerned, and, hence, possibly reveal some inherent distinctions between different texts, as it will be demonstrated later in this paper. d) Behavior of Letter Serial correlation densities in permuted texts.As we will see in this section, Letter Serial correlation densities, which, unlike the sums, are intensive quantities, behave quite differently from the coresponding total sums. Look at the graphs in Fig. 7 and 7a. Fig 7 was shown before and is reproduced here once again. Both graphs show the data for the same permuted text. While in Fig. 7 the sum Sm was plotted vs chunk's size n, in Fig. 7a the correlation density dm is plotted vs n.
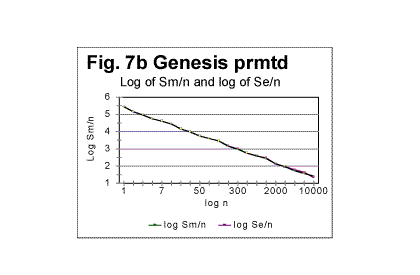
Comparing the graphs in Fig. 7a with the graphs shown previously in the section for expected densities (Fig. 1c) shows that the fluctuations of Sm about the level of Se in permuted texts, are largely eliminated in the densities' behavior. Again, the regression analysis of graphs in Fig. 7a reveals that the log de vs log n dependence for permuted texts is very closely represented by a straight line. An example of such a dependence is shown in Fig. 7b, where both log de vs log n and log dm vs log n dependencies are shown. The graphs for the expected and the measured densities are practically indistinguishable. This similarity of the structures of the expected and of the actually measured permuted texts was not revealed by viewing the graphs of total sums, but becomes obvious when viewing the graphs for densities.
The equations representing the graphs in Fig 7b (which are in this case almost identical for both de vs n and dmvs n dependencies) as obtained by means of a regression analysis are as follows: de=282523×n-1.0068 dm=282494×n-1.007 with correlation coefficients of 0.99998 for de and 0.9998 for dm. These results show that in the texts in this example, equation (20) for de is in effect, with q=1.0068 (instead of q=1 as it is required by the theoretical eq. 17; also, the curves in Fig. 7b are shifted vertically by T as compared with the curves described by eq. 20, which shift does not affect the curves' slopes, and is of no consequence for our discussion). For the measured density the values of q=1.007 and correlation coefficient of 0.9998 indicated the very good degree of randomization of the permuted text in question. These data will serve as reference levels for the analysis of real, meaningful, not permuted texts which are described in the following part of this report (see http://www.talkreason.org/articles/Serialcor3.cfm). In part 4 of this report a general discussion and interpretation of all the experimental data will be offered. Originally posted to Mark Perakh's website on February 9, 1999. |

